The only job application form that makes sense
11 Apr 2011
It just dawned on me that this is really the only job application form that makes sense, isn’t it?

11 Apr 2011
It just dawned on me that this is really the only job application form that makes sense, isn’t it?
7 Apr 2011
The following roots in something I heard from Jon Jagger at QCon London 2011 after his fantastic talk about Deliberate Practice. It was related to Test Driven Development. He asked “Why do cars have brakes?”. It made us think “To stop!”, but he said “No – to go faster”.
(Jon points out he didn’t invent it, he heard it from Kevlin Henney).
I have been thinking about this ever since, and here is what I came up with.
Imagine I would give you the keys to my car. I would tell you “here are the keys, you can drive wherever you want, including the highway, have fun!”
How fast would go? My car is not exactly a sports car, but it can do around 200 km/h. I guess we both agree that you would drive around 50 km/h within cities (the maximum allowed in Germany), and probably up to 200 km/h on the highway, as long as there is no limit.
Fine. Now image this: I would give you the keys to my car. I would tell you “here are the keys, you can drive wherever you want, including the highway, have fun! Oh, just one thing, the brakes don’t work.”
Now let’s forget for a moment that in reality, you probably wouldn’t start at all, if you had to drive, then how fast would you go? 10 km/h, maybe 20? Driving extremely cautious, always trying to look as far ahead as possible if you are going to need to halt? Yeah, I thought so.
But why is that? The brakes don’t have anything to do with the speed of my car – it’s still capable of doing 200 km/h just fine!
It’s because the ability to stop is what enables you to go real fast. With only a bit of exaggaration you could say that having a brake allows for a very “iterative” way of driving – no cars within the next 300 meters, let’s accelerate a bit – oh, there’s a car coming over from the right, let’s brake a bit – ok, now I can accelerate again – ah, there is a signal that suddenly turned red, no problem, I will stop here.
For me, this metaphor is the best I could find by now to explain to myself (and in the future, to others), why I really want to develop test-driven, and why it actually makes me faster, not slower, although I’m doing more.
Just as the brake doesn’t directly influence your driving speed, but does so indirectly, your tests won’t influence your coding speed directly, but indirectly. It’s because once they are in place, they allow you to iterate over your code and refactor it at what I, from my own experience, can only describe as the speed of light compared to conventional programming.
With tests in place, it’s like: Mh, what if I would split this rather long method into two? – ok, works; What if I put a bit more of dependency injection into this class? – ah, now this test here fails, no problem, I will have it back to green within minutes, I know exactly where to go to fix this; Hey, I could give this method here a better name – ok, still green; There’s this performance bottleneck deep inside this one class that is heavily used by a lot of other classes, let’s see if I can fix this – my tests will tell me if I accidently changed behaviour.
Compare this to conventional programming: You will never know for sure what breaks somewhere else if you change something. If you want to find out, you need huge amounts of manpower to have your webpage or UI tested for regression. What really happens is that you slow down to a near halt: because you don’t know what’s around the next corner when developing, and you know there is nothing that will immediately stop you and save you from harm if you take that next corner, you will drive, err, code so cautious, you won’t make any real progress.
On which Jon commented: “Yes. As the pragmatic programmers say, paraphrasing – you don’t know why it’s broken because you didn’t know why it worked in the first place.”
10 Mar 2011
I’m really into visualizations. More often then not I can only really “get” something (a complex system, an abstract idea, a process etc.) when I see it visualized. You could call this the transformation of gut feelings into images.
So, I had this (rather obvious) gut feeling that working iterative in software projects makes a lot of sense, I’ve heard all the arguments and explanations and examples and stuff like that, and I probably already “got it”, but I thought it could make sense to clearly work out why exactly it makes sense, by visualizing it. Surely it’s no rocket surgery what happens here, but I kind of like it and would like to share it.
So here’s my approach:
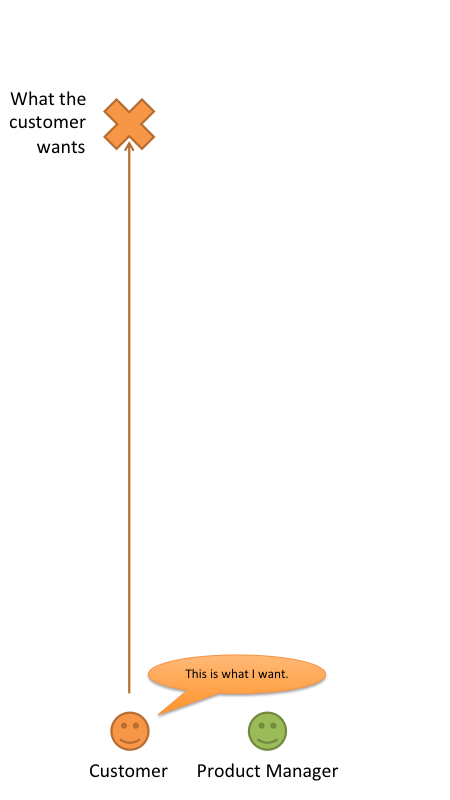
The customer tells a product manager what he wants him to build. Let’s see how a waterfall approach leads to the product team failing at this:
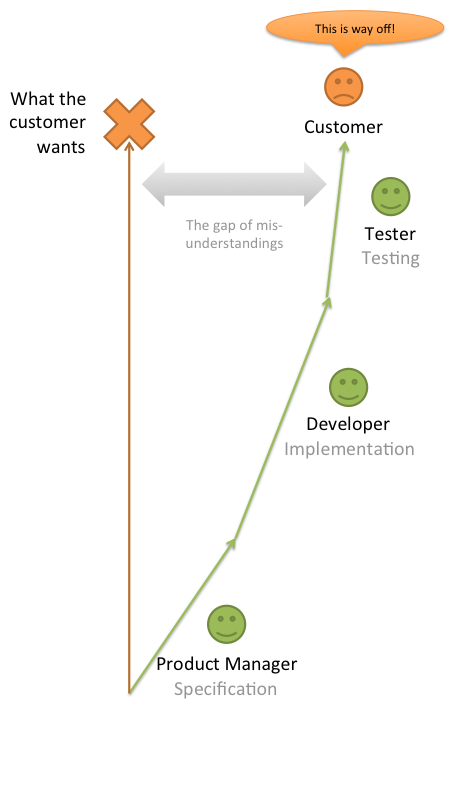
The reason why what is finally delivered isn’t what the customer expected is that the project goes through the hands of different people and different stages, and every time the project is given to another person or team, the amount of misunderstanding grows. That’s only natural because we cannot copy ideas from one brain to another in a 1:1 manner.
Here is why an iterative approach makes sense:
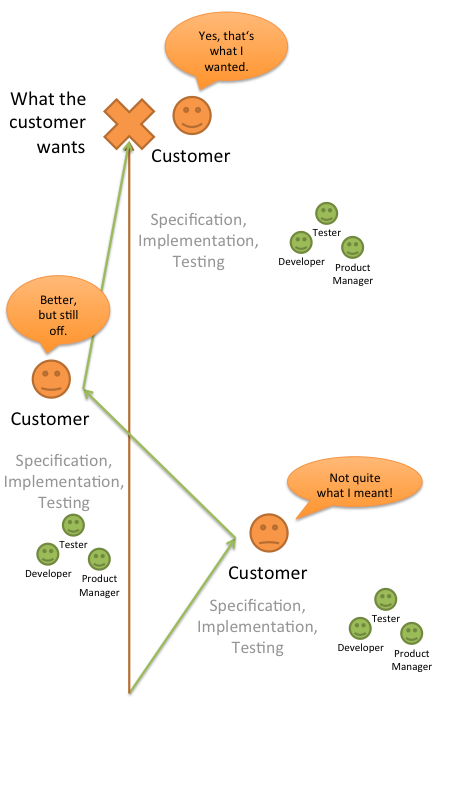
The project really starts the same: There is a certain amount of misunderstanding, and the team does things wrong. But due to the regular feedback from the customer, this wrong direction can be corrected. It might then move into another direction which is still a bit wrong, but then comes the next correction, and finally everything is on track.
11 Jan 2011
Platform Health Viewer is my current Ruby on Rails pet project.
Once stable, it will allow users to easily collect and visualize different types of statistical data which is typically produced by internet platforms, like CPU performance, user logins, HTTP requests etc.
The main application is build on Rails, the server used for data collection is written in node.js, the web interface makes heavy use of jQuery and uses Raphaël to create SVG graphs. Mass data is saved in a SQL db, other data is stored using CouchDB.
The project’s code is hosted on Github at https://github.com/ManuelKiessling/PlatformHealthViewer.
This video is a short introduction to the current alpha version of the project. A funny voice and lots of grammatical shortcomings are included for free:
Transcription of the video:
Hi. Platform Health Viewer – or PHV – is my current pet project. I need an easy and lightweight way to collect and visualize the different key performance indicators of the web platform I’m responsible for – stuff like CPU performance of important systems, user logins, http requests. So I started to play around with Ruby on Rails, jQuery, CouchDB and node.js, and here is an early alpha I would like to demonstrate. My primary goal was to make the process from feeding data into the system to visualizing that data as simple as possible. In order to get data into the system, all you need to make is an HTTP call, which makes it very easy to collect data from very different sources. Let’s try an example. I would like to visualize the cpu usage of my local machine. I’m going to collect this data using a standard unix command, sar. That’s an important aspect of my approach: It doesn’t play any role for the Platform Health Viewer where the data comes from, you’re completely free to choose how to collect it. This way you can feed really anything into the system, from generic data like CPU load to highly individual stuff like the user logins of your specific web site. Ok, here is how I can get my cpu “usr” value on my OS X command line: sar 1 1| grep Average| cut -b 14-15 Great, that will do. How do we push these values into the system? It’s a simple http post request using curl: curl –data “event[value]=`sar 1 1| grep Average| cut -b 14-15`&event[source]=macbook&event[name]=cpu_usr_percentage” http://localhost:3000/queue_event As you can see, the payload of the post requests is just 3 parameters: the source of the event, the name of the event, and its value. Again, you’re completely free here, you don’t need to configure event names and sources inside PHV – just define them when pushing data into the system, it will happily accept it. We will see in a moment how to make sense of different events that were pushed into the system. Ok, let’s use a small helper script I wrote in order to feed the CPU sys, idle, usr and nice values into my system: cat script/agents/macosx/cpu_overview_percent.sh As you can see, this is all done using only standard unix commands. Let’s start the script: bash ./script/agents/macosx/cpu_overview_percent.sh http://localhost:3000/ macbook I’m just providing two parameters here, the URL to my platform health viewer installation, which resides on the same host for this demo, and the source name, which I call “macbook”. As you can see, my script pushes all four CPU usage values into the system. Now let’s have a look at this data within platform health viewer. Well, the Dashboard is still empty, because we did not yet define any visualizations. But the “Tageditor” doesn’t show any events, too. This is because the events I pushed into the system have not yet been normalized to event-types. This is an additional step, because it will allow the system to push incoming events into the database as quickly as possible without the need to normalize those events regarding their name and source. This normalization is done using a rake task: rake queue:convert This task reads the events from the incoming queue, creates new event-types as needed, or connects the event values with existing event types if they already exists. It then deletes the incoming queue. Getting back to our tageditor, we can now see our 4 event types. An event type is the combination of an event source and an event name, so “macbook – cpu_idle_percentage” is one event type. Let’s see how we can use the tag editor to create something useful. Grouping one or more event types into a tag is what makes our data suitable for visualization. I’m not quite happy with the term “tag” by the way, maybe I will come up with something better. Anyway, let’s create a very simple tag which we can use to visualize exactly one value. I’m going to name my tag “macbook_cpu_usr”. It will hold all events whose source matches “macbook”, and whose name matches “cpu_usr_percentage”. I could type those parameters into the text box, but it’s easier to just drag’n'drop them there. Ok, let’s add this tag. Now we have this first tag, and to check if it works as expected, I can preview the values of the matching events. Let’s push some new values into our system and check if they are visible here. Ok, I’m starting my helper skript again in order to post new values to the server, and I start my rake task in order to normalize these values. Clicking again on “Show latest events” now shows these values. I will now start data push and normalization in a loop in order to get a lot of values. Ok, we still have no data visualization, so let’s do this now. Let’s switch to the Dashboard and add a frame, which is a container that will hold our graph. A frame is the visualization of all values connected to a tag, so I need to provide the name of the tag I want to visualize with this frame. “Add frame”, and here we go. A simple line graph representing one of my CPU values. The graph is actually an SVG, created using Raphael, an awesome JavaScript library. And thanks to jQuery, I can freely move and resize the graph. Let’s create a graph with all my CPU values in it. Back to the Tageditor, I’m going to drag all my values together. I can also create tags by combining event-sources and -names with already existing tags, as you can see here. Let’s check the values of my new tag, and there are all the different CPU values my script collects. Back to the Dashboard, I’m going to create another frame for my new tag. As you can see, this one contains 4 linegraphs and gives me a nice overview of my system’s CPU performance. Of course, a graph legend is needed, something that’s not yet implemented. Well, that’s it, that’s the current state of this project, I would love to hear your feedback, you can fork the code on github and drop me an e-mail. Thanks for your interest.

This is the homepage and blog of Manuel Kiessling.
Software gardener, test driven developer in PHP, Rails and JavaScript, Agile novice. Author of NodeBeginner.org. Father of two. CTO at MyHammer.
Follow me on Twitter: @manuelkiessling